Dashboard
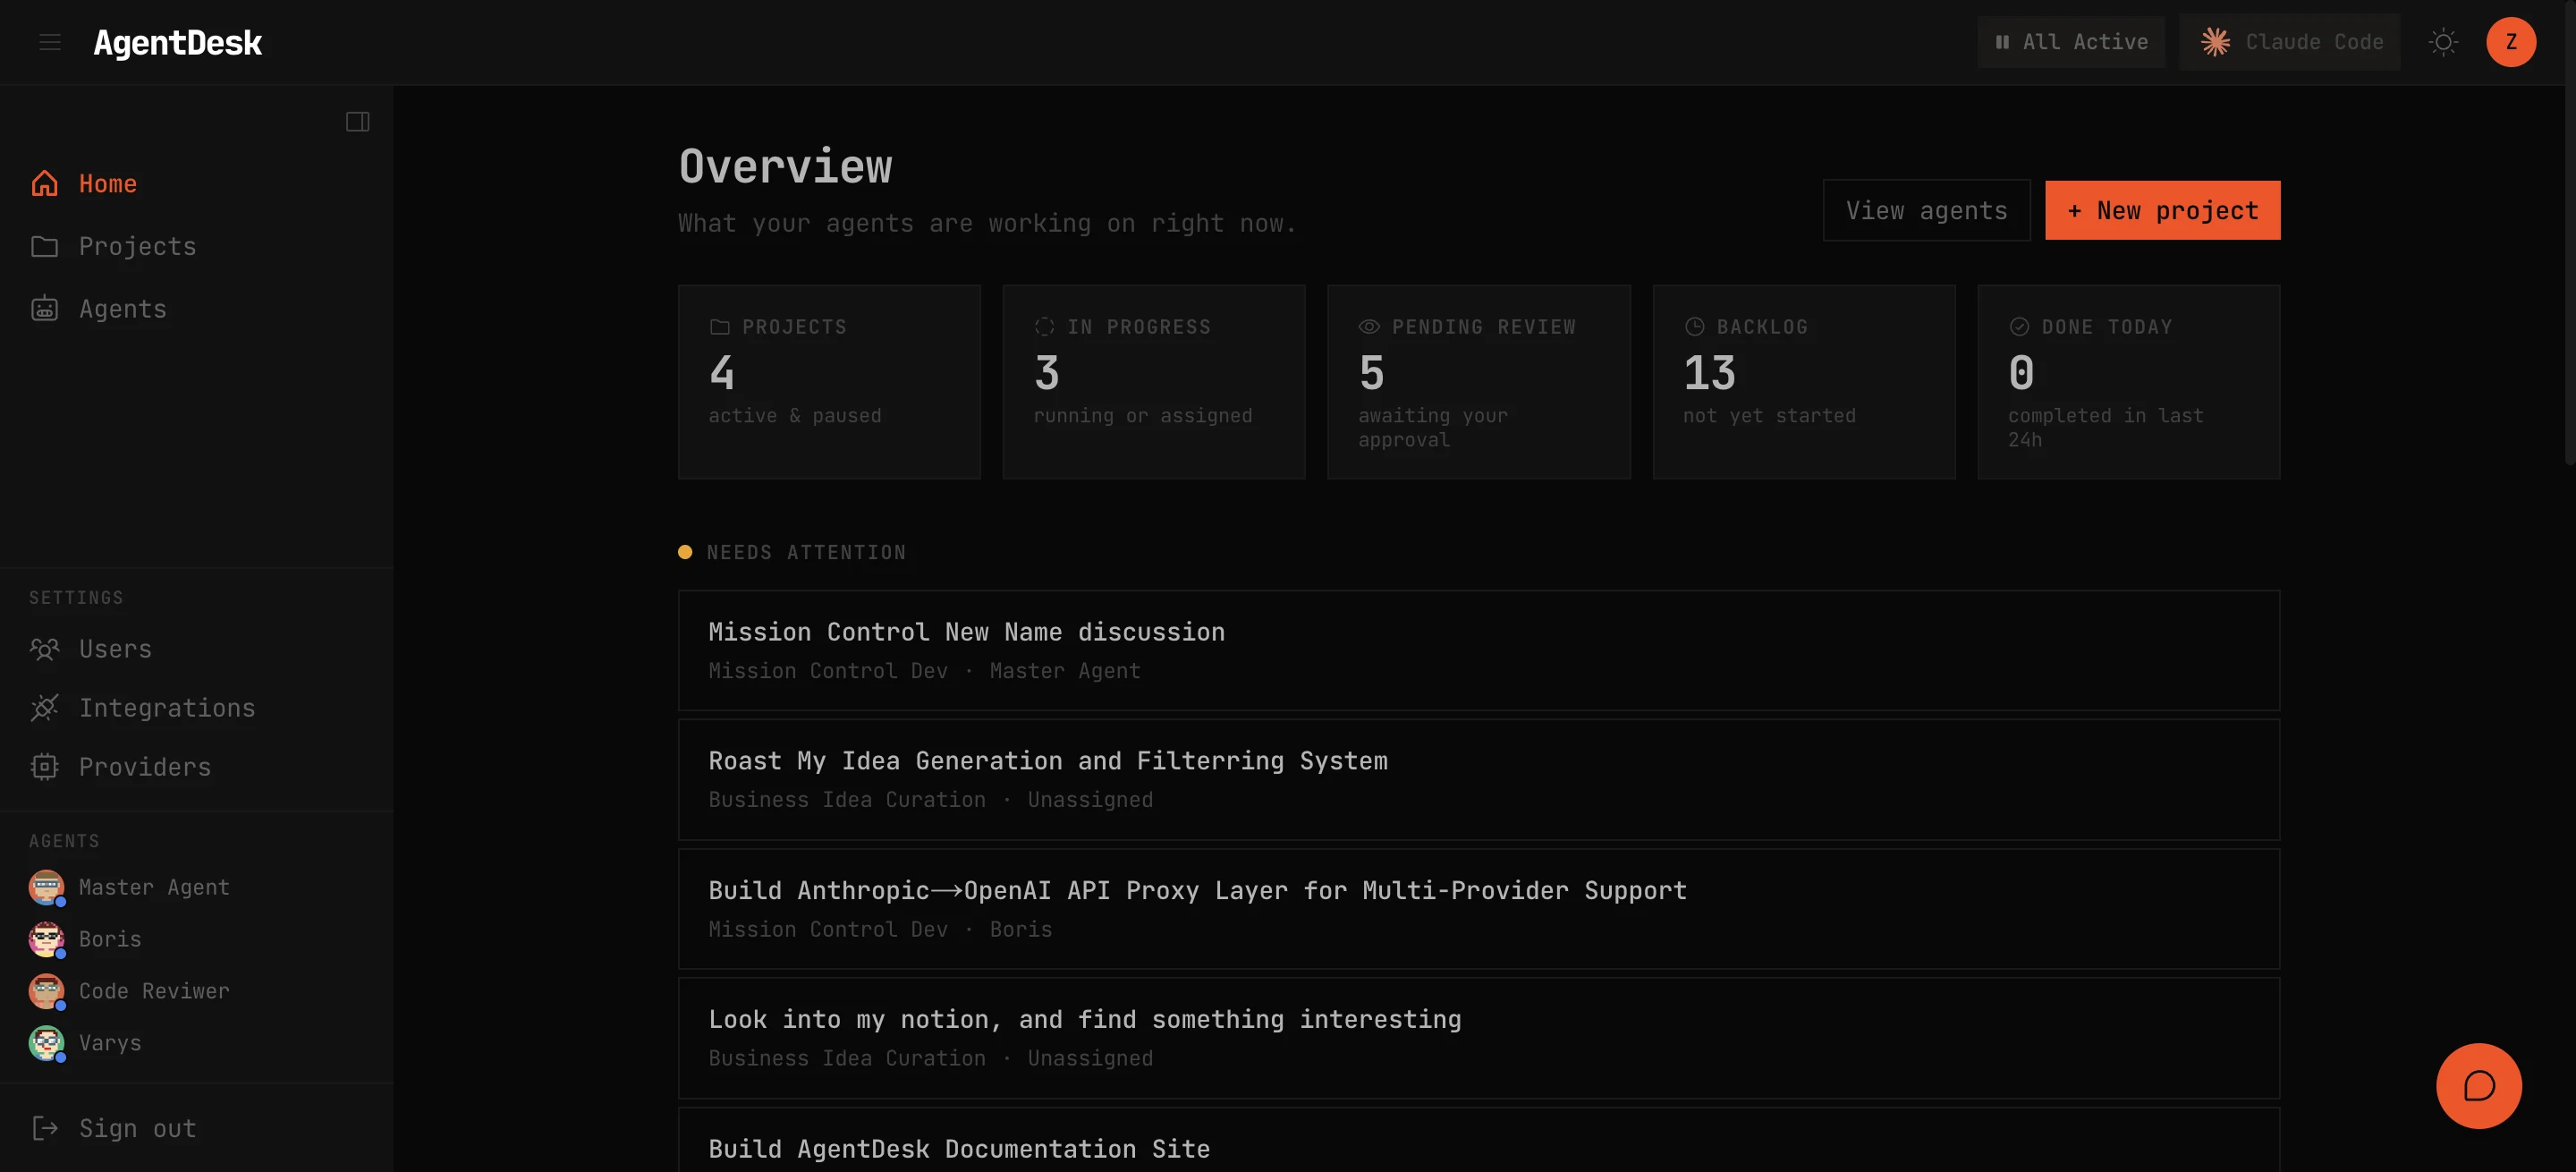
The AgentDesk dashboard — activity feed, project grid, agent status, and stats.
The dashboard is the home screen of AgentDesk. It gives you an at-a-glance view of everything happening across your projects and agents.
Activity Feed
The left panel shows a real-time activity feed of all actions across every project — task status changes, comments, agent runs, and cron executions. Each entry is timestamped and links to the relevant task or project.
Project Grid
The main area displays your projects as cards. Each card shows:
- Project name and mission statement
- Task counts by status (todo, in-progress, done)
- Active agents assigned to the project
- Last activity timestamp
Click any card to open the project’s Kanban board.
Agent Status Panel
The right panel shows all registered agents with live status indicators:
- Green dot — agent is currently running (executing a turn)
- Blue dot — agent is idle and available
- Gold dot — agent is paused
- Red dot — agent hit an error threshold and was auto-paused
Click an agent to open their chat session.
Stats
The top bar displays aggregate statistics:
- Total tasks across all projects
- Tasks completed today
- Active agents
- Cron jobs running